Monday 11 February 2013

Accelerating the Heat: Arctic Amplification

As I briefly mentioned in my previous post, the Arctic region has been considered a "canary in the coal mine", serving as an example of the real-time effects of climate change. Warming is happening twice as fast compared to other regions of the planet, a phenomenon dubbed "Arctic amplification" (Miller et al. 2010; Screen and Simmonds 2010). Perhaps even more alarming is that models have been underestimating the rate at which these changes are taking place, indicating that there are feedback mechanisms in place that are stronger than initially thought.

In this post, I want to explain the scientific processes underlying Arctic amplification. As I discussed in my last post, changes in the Arctic may have far-reaching effects, and even exacerbate global warming. Some authors have even gone as far as identifying the region as a so-called "tipping point" (Duarte et al. 2012) - all the more reason to understand what is going on, and what we might expect.

Key to the process of Arctic Amplification is the fact that the Arctic is a sea, covered by ice, surrounded by land. Antarctica, oppositely, is a continent surrounded by ocean. The ice plays a central role in autumn, when the air starts to cool, but the water is still relatively warm. By shielding the lower parts of the atmosphere, the ice actually supports further cooling. Without the ice, the water keeps putting in heat in the atmosphere, keeping it warmer and delaying sea ice growth in winter. Any ice that does form is less extensive, and thinner, making it more susceptible to melt the following summer.

Furthermore, the ice has a much higher albedo than sea ice, meaning that it reflects more of the incoming solar radiation (and therefore, heat). It thereby reduces the heat that enters the system to begin with. Without the ice, the ocean absorbs more heat, becoming warmer, leading to warmer ocean and atmosphere in fall. Not to mention that more open patches mean that there is more interaction between ocean and atmosphere, both strengthening the feedback process I described in the paragraph above.

To visualise these processes, I drew a conceptual diagram, to give an indication of the interactions and feedback loops. It is a (very) simplified overview, in which I try to highlight some of the processes described in Serreze and Barry (2011) - any mistakes, errors and/or omissions are entirely my own. It only serves here to outline the most basic effects taking place - in reality, there are also other processes occurring that may effect sea ice extent and melt.

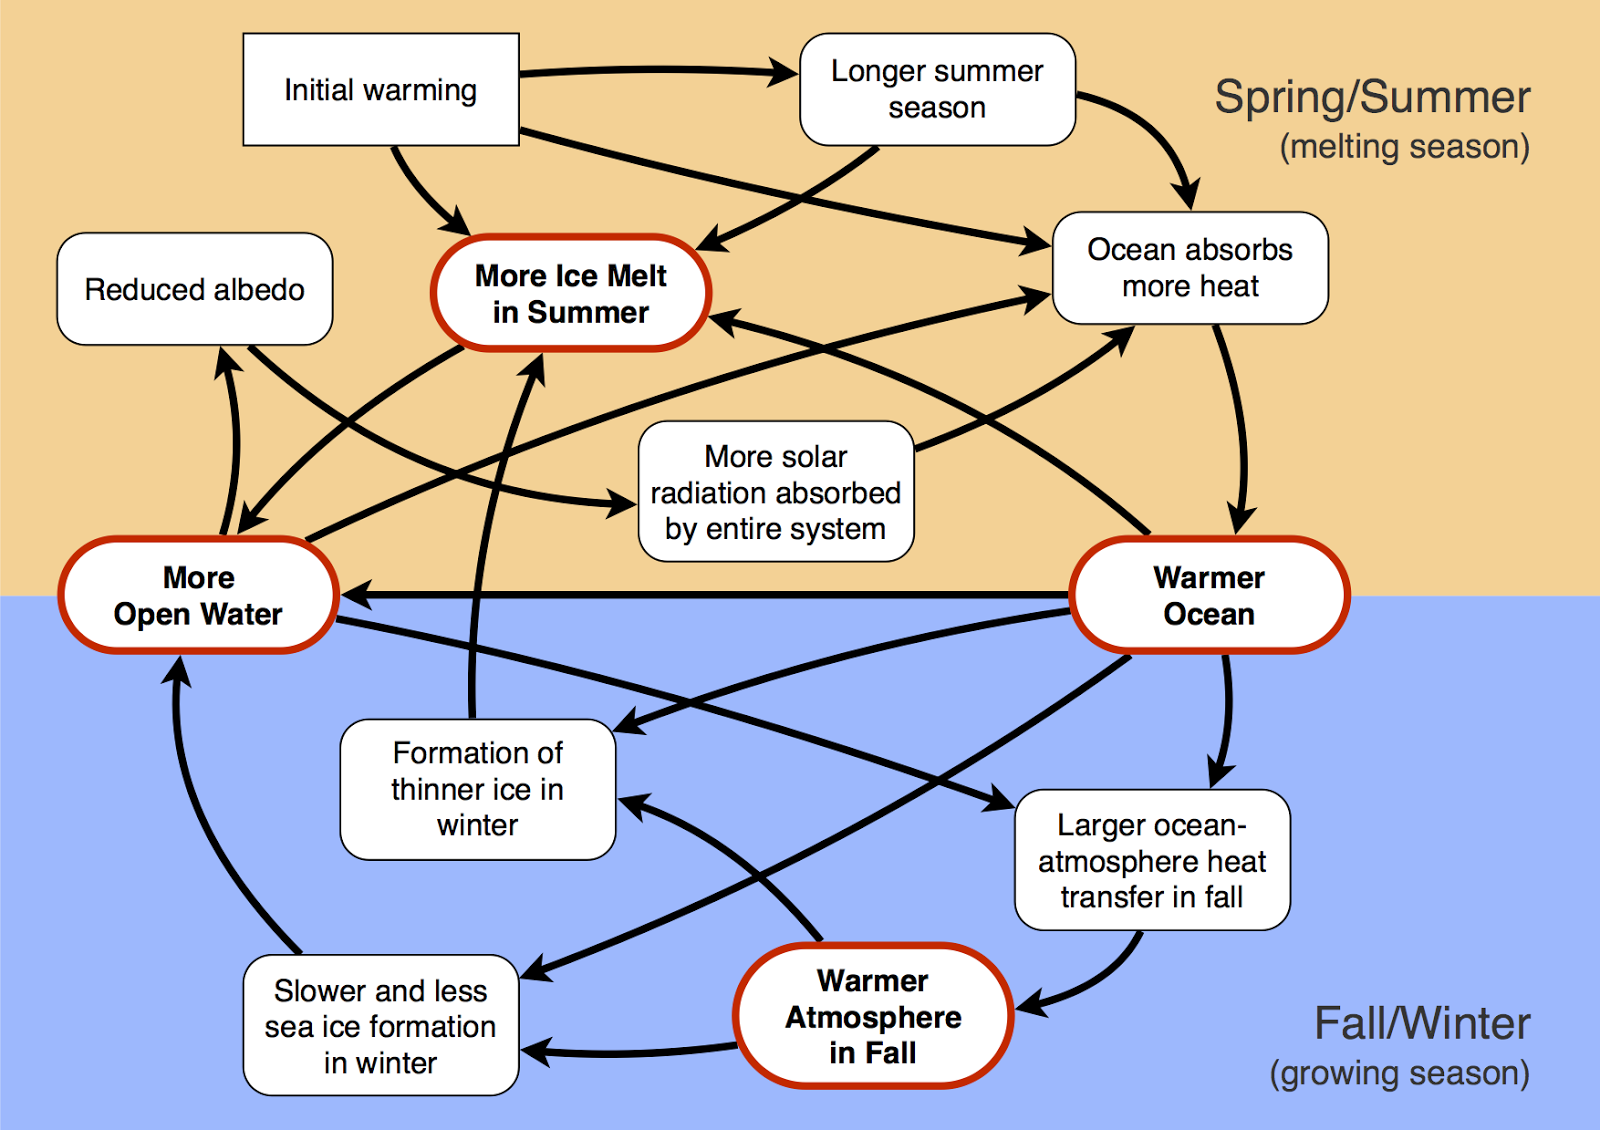
An overview of the most important processes in the ice-feedback systems in the Arctic. The most important effects are circled in red. Each feature has been moved to the appropriate season, except for 'Warmer Ocean' and 'More Open Water', which are of importance throughout the year (after Serreze & Barry 2011). 

As can be seen in the diagram, there are some processes with multiple effects, some that may have direct and indirect effects, and some that only effect other processes in later seasons. For example, a longer summer season means more ice melts overall, but it also means that the ocean has a longer time to absorb heat (and thus absorbs more heat in total), which leads to a warmer ocean, which leads to more ice melt. A warmer ocean also means that ice formed in winter will be thinner, which makes the ice more susceptible to melt the next year.

The recent observations of Arctic warming, declining summer sea ice extent, and a reduction in multi-year ice (which is typically thicker than first-year ice) indicate that these processes are taking place in realtime, and that we should not underestimate global warming - it is taking place before our eyes.

Further Reading

  • "The Melting North" - An article in The Economist from this summer, about the current melting in the Arctic and its implications

References


Wednesday 30 January 2013

Global Warming, Colder Winters: Arctic Sea Ice Melt and Cold Spells in Europe

It has been quiet for a while but I'm back after a load of coarse work. In my last post I mentioned geo-engineering, but I wanted to use this first post of 2013 to discuss the recent cold spell in Western Europe, North America and northern Asia. The icy conditions have led some people to dismiss current climate change ("if it's getting colder in winter, we can't possibly cause global warming!").

Climate change is a complicated issue to study for scientists precisely because the effects are not the same everywhere. It is a bit rash to conclude that global warming is a hoax based on a week of snow, just as one swallow doesn't make summer. Moreover, research suggests that global warming may actually cause colder winters in Western Europe, and other continents in the Northern Hemisphere, and it's got everything to do with the Arctic, and Arctic sea ice melt. Which ties nicely in with some earlier topics, and I thought it would therefore be interesting to discuss.

It does seem counterintuitive, a warm Arctic and colder continents. For clarity's sake, with colder continents, I mean relatively colder continents compared to the current average temperatures, and a warmer Arctic is an Arctic with higher than average temperatures there, not that Europe would become warmer than the Arctic. The crux is the anomaly, the difference between the present state and the average state over a longer period of time. 

Temperature anomalies for the Arctic region. The period of 2001-2010 is compared to the period of 1971-2000, the difference between them is the anomaly. As can be seen, warming in the Arctic is happening faster than in the surrounding regions. 

It is important to note that the Arctic, at the present, is the fastest warming region on the planet, and has often been dubbed the canary in the coal mine when it comes to real time observations of climate change (also see the figure above).

The Arctic is warming so quickly due to a process called Arctic amplification; something I will go into further detail in during a later post, but is somewhat out of the scope of this one. For now, just know that the warming is mainly caused by the enhanced albedo-feedbacks from melting sea ice (see this post for a quick refresher on those processes). The more sea ice melts in summer, the more the Arctic warms, leading to more sea ice melt, etc. 

So how does that tie in with colder winters in, say, Europe? Normally, cold polar air stays in the Arctic, trapped by strong polar vortex winds. This is called a positive Arctic Oscillation (AO). The polar vortex is a circulation pattern high in the atmosphere over the polar regions. 

Normally, the polar vortex is strong during winter, and the AO is positive. This means that there is low pressure over the Arctic region. As air moves from high pressure areas to lower pressure areas, the air flows toward the Arctic, and Europe and North America have mild winter temperatures. Strong winds circle the vortex from west to east and trap the cold polar air (see the left part of the figure below). If the polar vortex is weak, so the AO is negative, the pressure in the polar region is higher, the jet stream winds weaker and cold air is able to move to the surrounding continents, causing a sudden cold spell. The opposite can also occur, with warm air extending northward (see the right part of the figure).


A schematic representation of what happens when the polar vortex is strong (positive phase, left) and weak (negative phase, right). As can be seen in the right part, the jet stream meanders far more when the polar vortex is weaker, leading to colder air extending further south and warmer air going up north (Source: Wikipedia)

Melting sea ice in summer increases the temperature of the upper ocean layers, as the water absorbs the incoming solar heat. When the sun goes down in autumn, the air starts to cool, but the ocean is still warm, and releases its heat to the air. This increases atmospheric pressure over the pole, making it more likely for the polar vortex to be weak in the following winter, leading to cold spells on the surrounding continents (Greene & Monger 2012).

Even so, there is not a one on one relation between weaker polar vortexes and cold winters - the interaction between pressure gradients in the polar regions and in lower latitudes is complicated and much research is being done in understanding how the polar vortex might affect Europe, Asia and North America. Other weather indexes such as the El Niño system in the Southern Hemisphere also affect meteorological conditions around the globe (Greene & Monger 2012).

It is an interesting phenomenon though, and an example of the complex dynamics of the climate system. It also shows how sea ice melt in the Arctic affects weather here, and is another reason why it is important to study the Arctic. By being able to make better predictions of winter weather, society can prepare better for extreme conditions, minimising the surprise factor (Greene & Monger 2012). 

Next time, I'll write a quick post on Arctic amplification to explain some of the feedbacks that have caused the Arctic to warm so dramatically, and have astonished scientists (yes, astonished!).

Further Reading

References

Saturday 15 December 2012

Dirty Clouds

In my previous post I gave a short summary of how clouds affect the radiation and heat budget of the Earth, and the difference between low and high clouds. In a world with a changing climate, we all want to know what the effects of CO2, aerosols, and associated global warming will be on clouds and their feedback on the system. 

In truth, clouds are difficult to incorporate in climate models. They are small, the physics behind them are complex and not always well understood, and clouds have strong regional effects, all of which makes them complicated to model. Even so, knowledge of clouds is greatly improving, and so models are becoming more certain (for those interested in climate model certainty, always a hot topic, please see NASA on climate uncertainties and the IPCC on the confidence of model predictions in the 4th Assessment Report). 

First, let's just do a quick recap on what aerosols are. Basically, aerosols are all sorts of types of suspended particulate matter. Some occur natural, such as dust or organic compounds. A famous example of the latter can be found in the Blue Mountains in New South Wales, Australia, where the eucalyptus trees release a sort of organic matter into the mountain air. Incoming bluish ultraviolet light is scattered by the particles, giving the Blue Mountains their etymological characteristic.

Blue Mountains, NSW, Australia

However, humans are putting in a fair share of aerosols into the atmosphere as well. In a previous post I discussed the effect of soot deposition on snow in Antarctica. Other aerosols include sulphates from fossil fuels and other pollutants. In the picture below, Ramanathan and Feng (2009) have indicated the emissions of black carbon across the globe.

Emission of BC in tons per year across the globe. Note the emissions across the ocean along traffic routes of airplanes and ships. 

Aerosols alone can affect the incoming solar radiation by reflecting some of it back into space. In this sense, they increase the albedo. However, some of the radiation is absorbed, warming the atmosphere. As a net effect, the surface is cooled, and the atmosphere warmed (Ramanathan & Carmichael 2008).

In any case, like I said above, I want to investigate the effect of aerosols on clouds. Clouds are complicated, and studying the relation between clouds and aerosols is still not well understood. The IPCC rates the scientific understanding of the interactions generally as low to very low (also see the relevant section here). Even so, I want to discuss some of the basic processes.

Aerosols affecting cloud behaviour. 
Source: UK Met Office


Clouds form around small particles, called Cloud Condensation Nuclei (CCN). More aerosols mean more CCN, meaning more droplets that together form clouds. It also means that clouds become whiter, and thus more reflective. In this sense, aerosols can decrease cloud albedo and have a cooling effect (this is the first effect in the figure above).

Because there are more CCN, the droplets are smaller and it will take longer for clouds to form raindrops. This increases the lifetime of clouds as well as decreasing the number of rainfall events. This secondary effect, also known as the Albrecht effect, is not very well understood.

Lastly, there is the semi-direct effect. The aerosols in the clouds absorb radiation, and re-emit it, warming the clouds and reducing the upward flow of moisture - and the formation of clouds. This is perhaps the least-well understood effect.

I hope that this shows how complicated the relationship between clouds and aerosols is; there is no clear-cut correlation. Some effects increase cloud cover, whereas others reduce them. Clouds are difficult to study and model, which makes it tricky to incorporate them in climate projections.

Despite all this, scientists discover more and more about aerosols and clouds, which greatly improves the models for future climate projections. To finish off, I found this animated video of the cloud-aerosol effects I explained in this post.


Another interesting field related to clouds and aerosols has to do with geo-engineering, something I want to look at in my next blog post. For more information on research that is being done on clouds, I can recommend the Guardian article in the "Further Reading" section below, along with some other interesting websites. Happy browsing!

Further Reading


References


Saturday 8 December 2012

Every Cloud Has a Silver Lining: Albedo & Clouds

One of the most important components of the weather system, clouds, actually has a very important effect on the world's albedo. A lot of research is being done on different types of clouds - darker clouds have a lower albedo than white ones - how clouds are formed, and what the effects of global warming will be.

Night clouds 

Generally, clouds have a higher albedo than the surface underneath them, so they reflect more incoming sunlight than if they would be absent. In this sense, they have a cooling effect on the climate system. More clouds, more sunlight reflected, more cooling - or not?

The radiation coming from the sun is mostly in the same wavelength order as visual light, and is called shortwave radiation. The albedo of a given surface is the fraction of shortwave light that is being refracted. Nevertheless, not all of the light is reflected (as you'll remember from the first post). Some of the solar radiation is absorbed by the Earth, warming up the planet in the same way you get warmer from sitting in the sun. The Earth emits some of that energy in the form of longwave radiation, or heat.

In this image, you can see how clouds affect the distribution of shortwave and longwave radiation (Source: NASA)

Low and high clouds have different effects on the radiation budget. High clouds are usually thin and have low albedos. All things emit heat, even clouds, but because high clouds are quite cold, they emit less heat back into space. These two effects combined mean that high clouds have a net warming effect (also see NASA).

Low clouds do the opposite. They are thicker and have a higher albedo, and send more incoming shortwave radiation back to space before it can even reach the Earth's surface. They are closer to the Earth's surface, and their temperature is almost the same. This means that they radiate almost the same amount of longwave radiation as the planet. Even though they trap a great deal of longwave radiation as well, their net effect is cooling.

The image below is a compilation of cloud fraction cover as observed by NASA satellites. I recommend checking out the links below for further reading; these are also the links I used to do the research for this entry. Next entry I will look at the effect of pollution and aerosols on clouds and climate.

This animation shows the cloud fraction from 2005 to 2012


Further Reading & References


Friday 30 November 2012

From Icehouse to Hothouse: Breaking Out of Global Glaciation

Last week's entry was about how a global onset of glaciation could take place, the so-called runaway albedo feedback. Quick recap: due to some sort of cooling event, ice sheets start forming on the poles and beyond, increasing the Earth's albedo. The vast expanses of ice reflect high amounts of the incoming sunlight back into space, cooling the surface even further, and a runaway effect takes place, covering the Earth completely in ice, even the tropics. These "Snowball Earth" events have taken place in the Cryogenian,  800-550 million years ago. Recent research suggests that the Earth may have actually been ice-free in some spots near the equator, a hypothesis promptly named "Slushball Earth".

What has puzzled scientists is not only how the Earth might have wound up covered in ice, but also how these icy conditions were reversed (which obviously happened at some point, considering that there are not meters of ice covering me right now as I'm sitting behind my desk in London). It would have been very difficult for a world with such a high albedo to warm up again.

Imagine a world covered in ice, like this icy plain in the Arctic 
(Source: Reuters)

CO2, carbon dioxide, is a greenhouse gas, which traps part of the outgoing radiation of the Earth. The higher the concentration in the atmosphere, the more heat from will be trapped (creating the well-known greenhouse effect). The original proponents of the Snowball Earth hypothesis, Hoffman et al. (1998), suggested that extreme amounts of CO2 could have defrosted the planet.

The mechanism is relatively simple. While the Earth is in a state of glaciation, vulcanoes continue to work, sticking out of the ice like pimples. Vulcanoes are notorious emitters of CO2. The carbon dioxide they emit builds up in the atmosphere during the millions of years of glaciation. At some point, there is so much CO2 in the atmosphere that temperatures start to rise and the ice begins to melt. This reduces the albedo, which means more solar heat is absorbed by the now open ocean waters and land masses, leading to higher temperatures, leading to more ice melt, reducing the albedo... Etc.

This video shows how vulcanoes might have broken through the snowball state of the planet. I do want to add as a side note that this is a rather dated video and so it does not take some of the "Slushball" hypotheses into account, nor does it examine the arguments of opponents of "Snowball Earth" theory (also see last week's post). Having said that, it does explain nicely in the first seven minutes what the relationship between vulcanoes, CO2 and deglaciation is, which is why I've added it to this post.

This feedback loop would have taken place very rapidly (on a geological timescale, that is). In a mere couple of millions of years, the Earth would have bounced from a complete icehouse to a hothouse (Hoffman et al. 1998).

To return the planet from a "Snowball" or "Slushball" state, a lot of CO2 is needed (Pierrehumbert 2004). Crowley et al. (2001) calculated that about 120,000 ppm (parts per million) of CO2 would be required - which is roughly 300 times of the amount of CO2 currently in the air.

In a research conducted by Bao et al. (2009), oxygen isotopes in sulphate deposits in Svalbard from 635 Million years ago, roughly the end of the Marinoan glaciation, and one of the supposed "Snowball Earth" events, were studied to find whether CO2 levels had been that high. They concluded that either the oxygen cycle must have been very, very different from what it is today, or CO2 levels were extremely high, supporting the case for a "Snowball Earth".

Eyjafjallajökull, an Icelandic vulcano, erupts in 2010 

Nevertheless, that was not the end of the matter. An even more recent study by Sansjofre et al. (2011) reinterpreted the data, and found that CO2 levels were more likely around 3200 ppm, quite a bit less than the required 120,000 ppm. They suggest that glaciation was not as intense as thought before, or that perhaps there were different glaciation mechanisms at play.

To conclude; there is evidence that the world was once subject to intense glaciation, the extent of which remains under debate. Moreover, the end of this period and the processes behind the defrost are still uncertain and continue to be researched. Even so, it is interesting to see how important albedo can be, providing a feedback mechanism to enable glaciation, and to reverse it.

I wanted to add these two posts about the "Snowball Earth" hypothesis to give a bit of a framework when it comes to ice cover in the extremest sense of the word, even though "Snowball Earth" took place more than 550 million years ago. It is by studying these obscure details of the planet's natural history that we are able to better understand climate in general, and what that means for us today.

Next post: clouds - perhaps the most enigmatic (and important) component of the climate system.


References


Wednesday 21 November 2012

Frozen Planet: Snow or Slush?

So far, we've mainly looked at the present day climate mechanisms, but for this blog post, I want to go back in time - and quite a bit. Between 800-550 million years ago, during the period in the Neoproterozoic that that geologists call the Cryogenian (from Greek cryos, "cold" and genesis, "birth"), some scientists believe that the Earth was covered largely by ice, in some places up to 5 km of it. This "Snowball Earth" hypothesis  by Hoffman et al. (1998) has been scrutinised, critisised (Allen and Etienne 2008) and praised - but how does it actually work?

There are several possible situations that can trigger a Snowball Earth, but we'll examine those later. For now, let's just assume it gets cold. Really, really cold. Ice starts creeping from the poles to lower latitudes, a bit like the more recent Ice Ages. But unlike those, they don't stop. The ice goes further towards the equator. Meanwhile, all that icy surface reflects a lot of sunlight back into space because of it's high albedo, causing the planet to cool even further. At some point, there is so much ice that a runaway effect takes place: the planet's albedo is so high, that the amount of sunlight that is absorbed is too small to keep the Earth warm, and the planet freezes over.

Geologists believe that this feedback scenario happened during the Cryogenian, and that it happen not just once; most likely, three times. The BBC has made an informative short film that explains how scientists found evidence for a Snowball Earth event.


There is much uncertainty as what triggered a Snowball Earth. It has been suggested that the evolution of photosynthetic organisms caused a reduction in methane (a potent greenhouse gas), as the oxygen they put into the atmosphere reacted with the methane to form the weaker greenhouse gas, CO2. This could have ultimately lead to a cooling effect (Kopp et al. 2005).

Another theory proposes that the break-up of the continent Rodinia as the onset of the cooling (Donnadieu et al. 2004). The researchers looked at increased runoff following the continental disintegration. Higher runoff would mean more weathering, which through chemical processes could lead to a reduction in CO2 and thus to cooling.

Reconstruction of the breakup of Rodinia, 750 million years ago, based on palaeomagnetic data (Torsvik 2003)

Despite these and other proposed mechanisms (lower solar input, changes in orbital forcing, etc., also see Hoffman et al. 1998), there has been no conclusive answer as how the world changed into an ice house.

Dropstones in formations in the Flinders Ranges, SA, Australia

Some scientists have further studied the dropstones, and in fact discovered evidence that seems to contradict a world fully covered by ice during some of the glaciations (Le Heron et al. 2011). Markings on the dropstones from the Flinders Ranges shows that they were deposited by ice, but have been affected by turbulent waters as well. If ice had covered all the oceans, the water underneath it would have been gentle and calm. The turbulence would have been caused by storms raging over ice free patches; instead of Snowball Earth, there would have been a "Slushball" Earth. They suggest that these patches are the places in which some organisms managed to survive the chilly conditions (Allen & Etienne 2008, Le Heron et al. 2011), and ultimately emerge when the ice disappeared again.

Artist's impression of "Slushball" Earth, with pockets of ocean

For the next blog entry, I'll look at how the planet came out of this icehouse situation - not going into a greenhouse, but a hothouse, and how that too was impacted by the albedo effect.

Further Reading


References